Observations of a Unique Helix in the Solar Corona
THE PAPER: Gary, G. A., and Moore, R. L., 2004 "Eruption of a Multi-Turn Helical Magnetic Flux Tube in a Large Flare: Evidence for External and Internal Reconnection that Fits the Breakout Model of Solar Magnetic Eruptions", Astrophys. J., submitted.
ABSTRACT: We present observations and an interpretation of a unique multiple-turn spiral flux tube eruption from AR10030 on 2002 July 15. The TRACE CIV observations of this clearly-observed helical flux tube, from within a sheared magnetic field, is interpreted in the context of the breakout model for magnetic field explosion. The initiation of the helix eruption starts 25 seconds after the peak of the first impulsive spike of microwave gryosynchrotron radiation early in the eruptive phase, implying that the sheared core field is not the site of the initial reconnection. Within the quadrupolar configuration of the active region, the external and internal reconnection sites are identified in each of two consecutive eruptive flares that produce a double CME. The external breakout reconnection apparently releases an underlying sheared core field and allows it to erupt, leading to internal reconnection in the wake of the erupting helix. This internal reconnection heats the two-ribbon flare and might or might not produce the helix. These events lead to the first CME and are followed by a second breakout that initiates a second and larger halo CME. The strong magnetic shear in the region is associated with rapid proper motion and evolution of the active region. The multiple-turn helix originates from above a sheared-field magnetic inversion line within a filament channel, and starts to erupt only after fast breakout reconnection has started. These observations are counter to the standard flare model and support the breakout model for eruptive flare initiation. However, the observations are compatible with internal reconnection in a sheared magnetic arcade in the formation and eruption of the helix.
THE HELIX: On 2002 July 15, the Transition Region and Coronal Explorer (TRACE) instrument was in a 160 nm flare mode when an X3 X-ray flare in AR 10030 occurred. The active region was observed throughout most of the day in a flare monitoring mode with 768x768 pixels of a spatial resolution of 0.”5. The UV continuum 160 nm images capture the two-ribbon flares and other regional brightenings. The spectral response of the 160 nm filter peaks near 155 nm and captures the strong CIV resonant line pair emission from the transition region at 100,000 K in the flaring stage. During the preflare phase, TRACE captures transient brightenings probably related to flux emergence, flux cancellation, and less dramatic magnetic field restructuring. An important sequence of images shows a helix eruption. The images below show the helix eruption starting at 20:04 UT, about one minute into the flare according to the NOAA flare listing. The eruption occurs on the eastern side of the leading spot along the sheared-field neutral line (labeled Lb in the MSFC Vector Magnetogram figure).
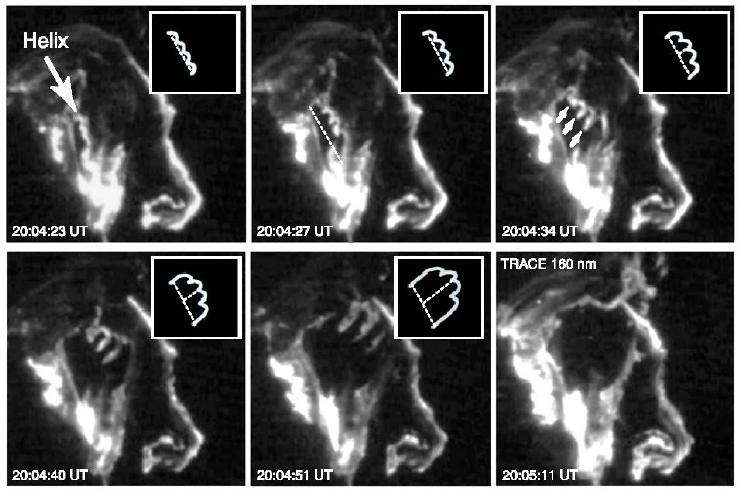
MOVIE LINK: T1600_020715_20Xflare.mov (7.5 MB Quicktime movie)
THE ACTIVE REGION : AR 10030/ 2002-JULY-15
MSFC Vector Magnetogram (below) showing sheared magnetic fields across the neutral line (segments La, Lb & Lc).
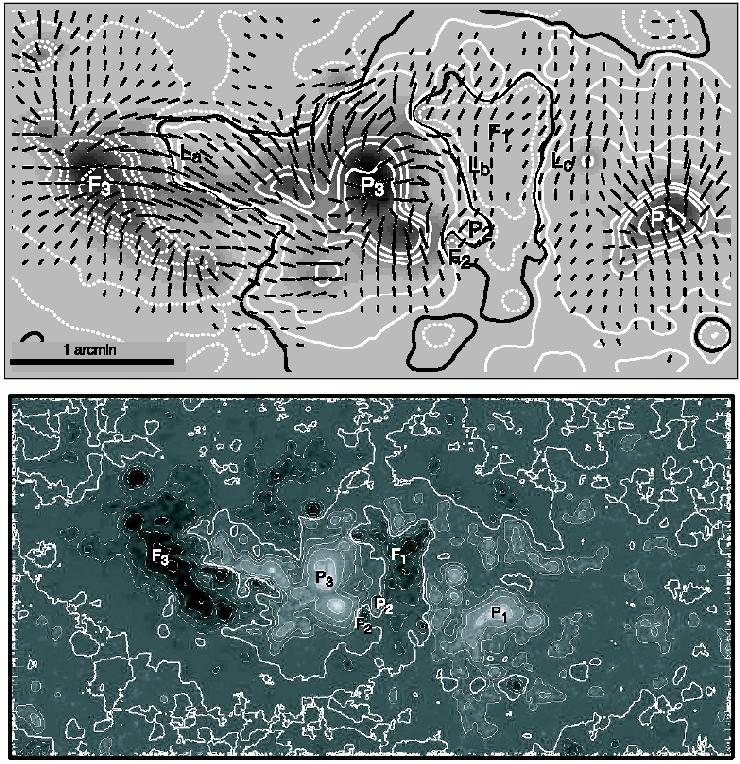
SOHO/MDI Longitudinal Magnetogram (above) showing a larger field of view with the same labeling of the magnetic features.
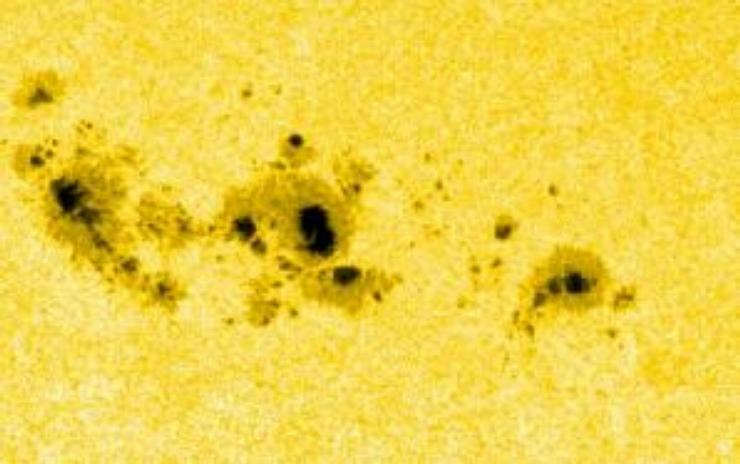
TRACE White Light Image of the active region:
There are ample observations to give the general nature of the magnetic field topology associated with the event. Given below is a set of movies showing both data and geometric models related to the activity of the region.
MOVIES:TRACE movie of the CIV HELIX
TRACE movie of the CIV activity of the AR 10030 (20:00-20:44)
TRACE movie of the CIV activity (Positive)
SOHO/LASCO C2 movie of the CMEs
SOHO/MDI movie AR 10030 (July 15)
Model of helix eruption using 3 Loops
Model of helix eruption using 5 loops
Model of multiple-turn helix relaxing
Liu
et al. 2002 CIV difference movie
Scharmer
et. al 2002 G-band Movie of Sunspot P3
SCHEMATIC INTERNAL AND EXTERNAL
RECONNECTION:
(See paper for details)
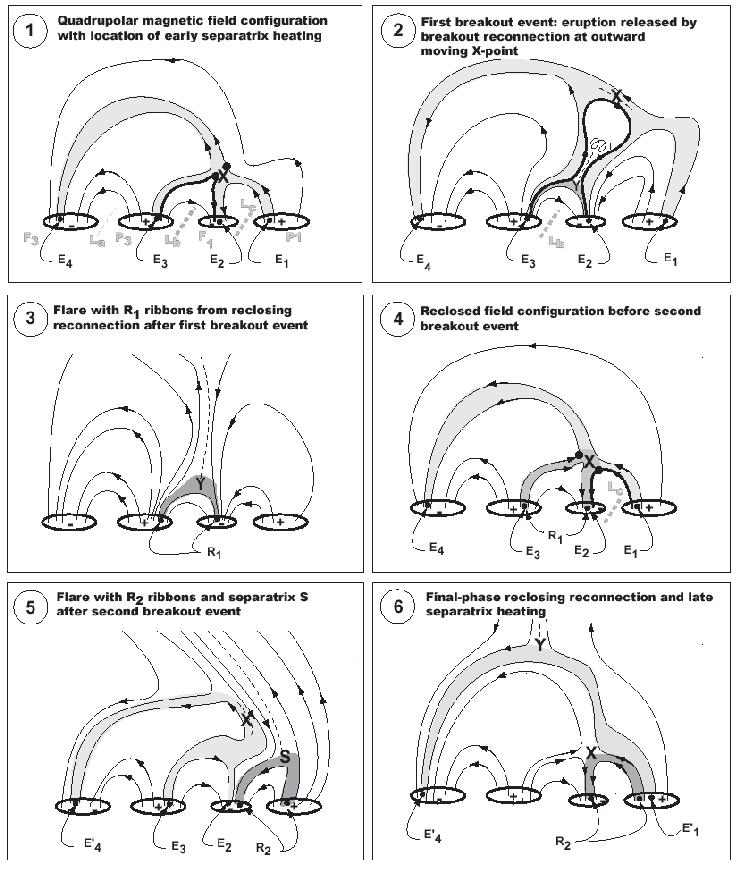
INTERPRETATION: In the figure above, six stages of the scenario for the double-flare, double CME event of July 15 is shown. The slow reconnection at the X-point feeds energy to heat the separatrix regions; the points E1-E4 are the intersection of the associated separatrices (shown in light gray) with the photosphere. The magnetic topology shown here has been simplified. As the magnetic field evolves through stress relief above the neutral line Lb, progression of the reconnection and eruption of the sheared core field move the X-point upwards, as illustrated in panel 2. Following Antiochos (1998), the additional flux allows the reconnection to transfer sheared flux to the unsheared region and removes the overlaying field allowing the field to breakout. As the process precedes the separatrix emission increases. With this breakout the field over Lb weakens and allows either the pre-formed helix to erupt or allow the helix to form and erupt via internal reconnection. The breakout event is confirmed by the ejection of the first, slow CME. The reclosing reconnection along the current sheet powers the two-ribbon flare R1 seen above the Y-point null in panel 3. This reclosing reconnection also powers the second and third microwave spikes. During this period the soft X-ray flux reaches its maximum and the microwave burst r2 and r3 occur. In panel 4 the reclosed field configuration is shown as it is well after the first breakout and before the second breakout event. The second breakout event is produced by the expanding stressed field over Lc. Due to the stressed magnetic field and the now weakened overlaying magnetic loops as result of the first breakout, the flux over Lc expands outward. With rapid reconnection on the east side of the expanding breakout, the stressed flux associated with Lc moves outward forming a current sheet behind and a current sheet on its east side. The result of this expansion is the configuration of panel 5. This breakout eruption is manifested by the second filament eruption and the beginning of the second two-ribbon flare (R2) as recorded by the fourth microwave burst. The opening of the field the second time, i.e. the second breakout, is confirmed by a second and faster CME. The second CME is faster perhaps due to the weakened field configuration resulting from the first breakout. The final-phase reclosing reconnection is shown in the panel 6. This interpretation is based in part from the following sequence of TRACE images.
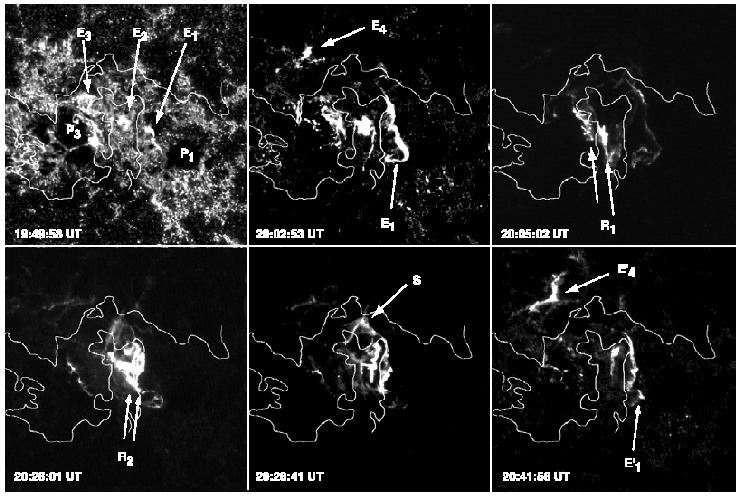
SEQUENCE: TRACE 160 nm images of key events in the X3 flare. At 19:49:58 and 20:02:53 UT the emission patches E1, E2, E3, & E4 are located at separatrix sites. The first eruption produces the two flare ribbons R1 (shown at 20:05:02 UT) across the sheared-field neutral line Lb. At 20:28:01, a second eruption produces the two flare ribbons R2 across the sheared-field neutral line Lc. At 20:28:41, an upper atmospheric coronal separatrix (S) is seen. Movies of the event make this interpretation clear. In the later phase of the flare, at 20:41:58 UT, re-closing reconnection of the field again brightens separatrix site E4. The thin line is the main neutral line.