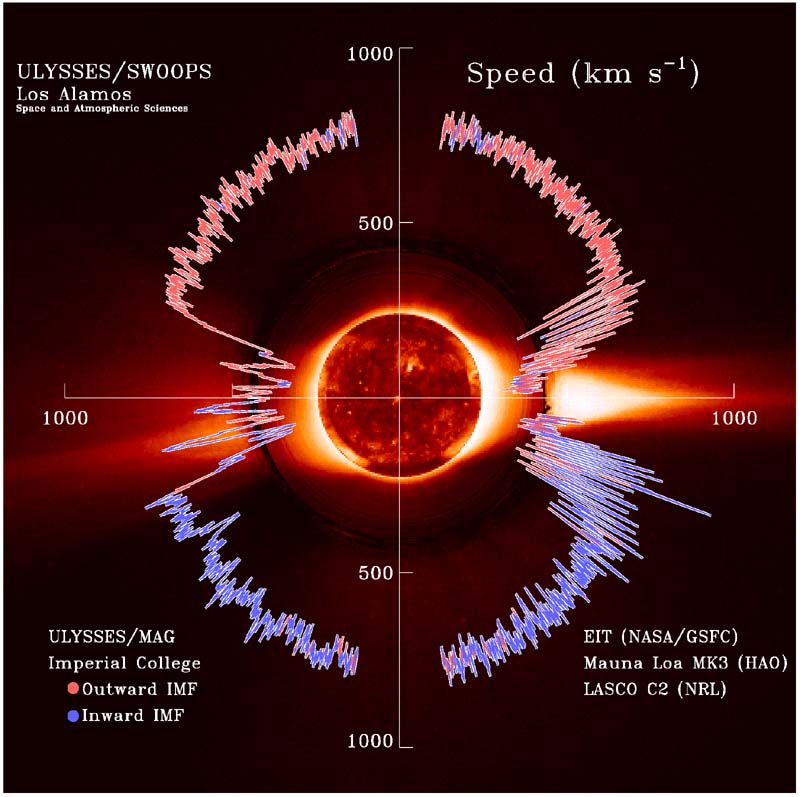
"Bimodality"The graphic picture of bimodality is the “dial plot”, shown below, of solar wind speed versus heliographic latitude measured by Ulysses starting at the Jupiter encounter (right side, south of the equator), going around clockwise to the south polar passage, then the fast latitude scan from 80o S to 80o N latitude between 1994 and 1995 (Ulysses was ~2.2 AU over the poles and ~1.4 AU at perihelion, at the equator), and finally back towards the equator and the second aphelion (right side, just north of the equator). This plot shows that fast wind is steady and that the transition to slow wind is nearly discontinuous, occurring here at latitudes of about +/-15o. Seen here is the configuration near solar minimum, the same as shown in the solar image on the introductory Solar Probe web page (it is expected that near solar maximum the region of steady, fast wind will be much smaller or absent). High temporal resolution measurements show that fast wind contains a field of evolving MHD turbulence while fluctuations in the slow wind are of longer period and more characteristic of a transient source than in the fast wind. This beautiful picture shown here first appeared on the cover of GRL (January 1, 1998) and is sometimes referred to as "the ultimate dial plot" since several simpler, less colorful versions appeared earlier. |

|
|
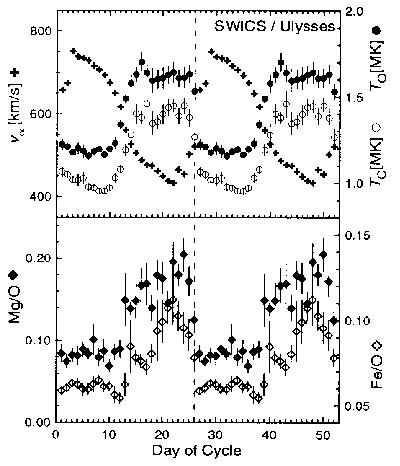
Composition and "Freese-In" TemperatureThe charge state distribution is characterized by a single, low freezing-in coronal temperature of ~1x10⁶ K for each element, as shown for Oxygen and Carbon in the top panel of the figure at the right. The composition is least biased in the fast wind (closely resembling photospheric composition) as shown by the abundance of Mg and Fe relative to Oxygen in the bottom panel of the figure at the right. Conversely, Mg and Fe are overabundant and the freezing-in temperatures are high and variable in slow wind. These close correlations with flow speed for a coronal process (freezing-in temperature) and a chromospheric process (composition) show that the boundary between fast and slow wind is a sharp boundary extending all the way down to the chromosphere. This is one reason that it is now believed that slow wind originates in streamers. This figure shows the He ion speed, O and C coronal freezing-in temperatures, and Mg/O and Fe/O abundance ratios. These Ulysses/SWICS data are repeated to facilitate recognition of the sharp boundary between fast and slow wind (Geiss et al., 1996). The alpha particle speeds are very similar to the proton speeds shown
above in the dial plot. The sharp boundary between fast and slow wind is
again evident.
|
 |
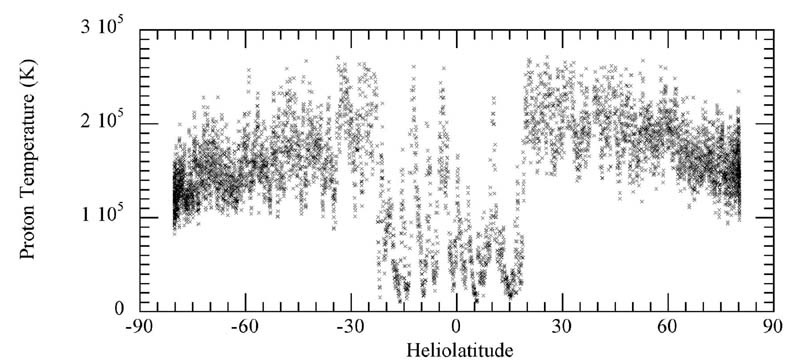
Proton Temperatures |
 |
The solar wind is bimodal with differing compositions, temperatures, temperature anisotropies, speeds, small scale fluctuations, and intrinsic variabilities between the two states. The fundamental importance of these differences was only appreciated after Ulysses’ first orbit. How the differences above are created in the solar corona. |

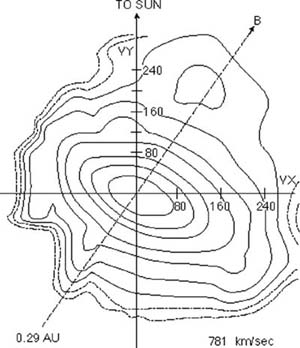
Contours of solar wind proton velocity distribution in fast wind at 0.29 AU measured by Helios. Contours are 0.8, 0.6, 0.4, 0.2, 0.1, 0.03, 0.01, 0.003 and 0.001 of the maximum phase space density. The distribution is anisotropic (Tperp > Tparallel), hot, and has a faster component along the magnetic field direction (dashed line) (Marsch et al., 1982). |
| This is page 3; Next:
3 June 1999 |