
 |
|
+ Home | ||

|
||||
| + Solar Cycle Prediction | + Magnetograph | + The Sun in Time | + The Hinode Mission | + The STEREO Mission |
Slide Show
page 9 for |
|
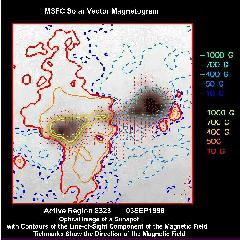
This image is a product of the work done with Marshall Space Flight Center's Vector Magnetograph. The contours represent one component of the vector magnetic field (the line-of-sight component). The tickmarks represent the direction of the other component (the transverse) of the field.

click on image for a larger version
(130 kB jpeg image)
By studying the orientation of the transverse component of the field with respect to the neutral line*, scientists may be able to predict the probability of a solar flare.
*neutral line -- where the positive and negative polarities of the magnetic field of each individual spot cancel, here where the solid red and dashed blue lines come together.
This is the End!
Press Here for the
Previous Page
To return to Slide Show Index, click here.
To return to the Sun in Time home page, click here.