|
|
|
+ Home | ||

|
||||
| + Solar Cycle Prediction | + Magnetograph | + The Sun in Time | + The Hinode Mission | + The STEREO Mission |
Surface Waves and Helioseismology
|
5-minute OscillationsPatches of the surface of the sun oscillate up and down with a typical period of about 5 minutes. The nature and source of these "5-minute oscillations" was a mystery for many years after their discovery in 1962. These oscillations are shown in the image on the left as areas of blue and red where the blue areas are moving toward us (blue-shifted) and the red areas are moving away from us (red-shifted). The fact that this signal is strongest near the center of the imaged disk of the sun and weakest near the edge indicates that the motions are primarily radial - inward and outward. A movie (3.7Mb MPEG) constructed from a series of these images (taken at the rate of one per minute for 150 minutes with the GONG network instruments) shows how individual patches are blue-shifted and then red-shifted through several cycles. The result is an apparent chaotic vibration of the sun. | ||
|
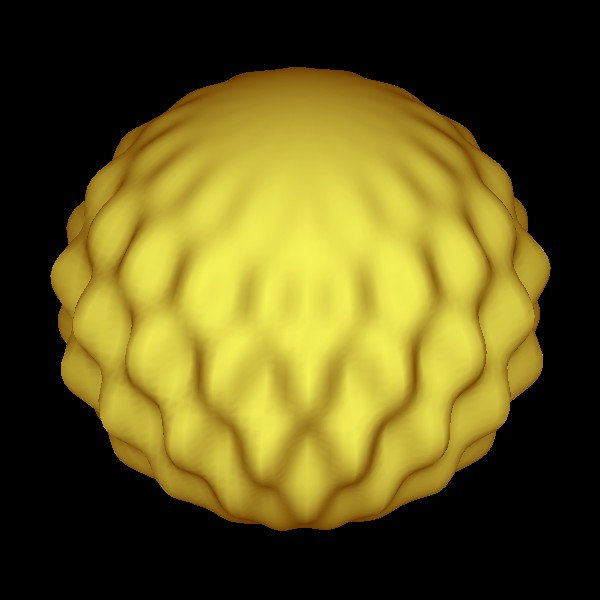
p-ModesThe mysterious source of these oscillations was identified by way of theoretical arguments in 1970 and confirmed by observations in 1975. The oscillations we see on the surface are due to sound waves generated and trapped inside the sun. Sound waves are produced by pressure fluctuations in the turbulent convective motions of the sun's interior. As the waves move outward they reflect off of the sun's surface (the photosphere) where the density and pressure decrease rapidly. Inward moving waves are refracted (their direction of motion bent) by the increase in the speed of sound as the temperature increases and eventually return to the surface. These trapped sound waves set the sun vibrating in millions of different patterns or modes (3.7 Mb MPEG movie). Since sound is produced by pressure, these modes of vibration are called p-modes. One mode of vibration is shown in the image above as a pattern of surface displacements exaggerated by over 1000 times. A movie (1Mb MPEG without audio, 6.5 Mb MPEG version with audio) shows how this mode of oscillation consists of two oppositely moving waves. | ||
|
HelioseismologyThese sound waves, and the modes of vibration they produce, can be used to probe the interior of the sun the same way that geologists uses seismic waves from earthquakes to probe the inside of the earth. Some of these waves travel right through the center of the sun. Others are bent back toward the surface at shallow depths. Helioseismologists can use the properties of these waves to determine the temperature, density, composition, and motion of the interior of the sun. A number of fascinating discoveries have been made in the last few years using the science of helioseismology. The image above (from M. J. Thompson) shows the internal rotation rate of the sun with red for fast and blue for slow. The variation we see at the surface between the equator and the poles extends inward and then rapidly disappears at the base of the convection zone (shown by the dashed line).
|