 |
|
+ Home | ||

|
||||
| + Solar Cycle Prediction | + Magnetograph | + The Sun in Time | + The Hinode Mission | + The STEREO Mission |
Solar Flares and Magnetic Shear
|
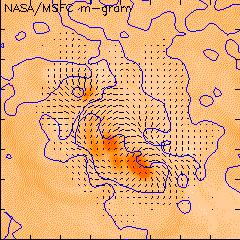
This region (NOAA Active Region AR6659, June 10, 1991) produced some of the most powerful flares ever recorded and remained active over many days. It also illustrates how magnetic shear (twisting of the Sun's magnetic field), is related to solar flares. The data shown here were taken with the Marshall Space Flight Center's Vector Magnetograph and the co-aligned Hydrogen alpha (H-alpha) telescope. The vector magnetograph looks at light with a wavelength of 525.0 nanometers produced by iron in the solar photosphere. The H-alpha telescope is sensitive to the spectral line at 656.3 nanometers, originating in the Sun's chromosphere, the layer of the solar atmosphere just above the photosphere. Thus, the magnetic fields traced by the chromospheric structures in the H-alpha image overlay the photospheric field measured by the vector magnetograph. | ||
|
The sequence of images shown above spans more than a nine hour period from 12:07 to 21:20 Universal Time (UT), (7:07am to 4:20pm central daylight savings time). The data include two M-class flares: an M6.4 flare starting at 13:53 UT and ending at 15:27 UT; and an M3.2 flare starting at 16:53 UT and ending at 18:01 UT. The H-alpha images are displayed in the left-hand panel of the animation. The magnetic field measurements are displayed on top of the H-alpha image in the right-hand panel. The solid lines are "neutral lines" that separate areas with opposite magnetic polarity (positive from negative or north from south). The tickmarks point in the direction of the horizontal, or transverse, component of the magnetic field. Normally the transverse field is directed across (or perpendicular to) the neutral lines so that the magnetic field lines travel from the positive polarity regions directly to the negative polarity regions. In this example we see several areas where the tickmarks are directed almost parallel to the neutral lines. The magnetic field is said to be sheared in these regions. Over the last few years we have found that flaring activity is closely associated with sheared magnetic fields. Measurements of magnetic shear in and around sunspots allows us to predict the occurence of many large solar flares. | |||
