|
|
|
+ Home | ||
|
||||
| + Solar Cycle Prediction | + Magnetograph | + The Sun in Time | + The Hinode Mission | + The STEREO Mission |
3D Coronal Magnetic Fields
|
Magnetic field lines loop through the solar atmosphere and interior to form a complicated web of magnetic structures. Many of these structures are visible in the chromosphere and corona, the outermost layers of the Sun's atmosphere. However, we measure the magnetic field itself in the photosphere, the innermost layer of the Sun's atmosphere. A variety of techniques are then used to mathematically map these magnetic field measurements into the outer layers where they can be compared with the observed structures. | ||
|
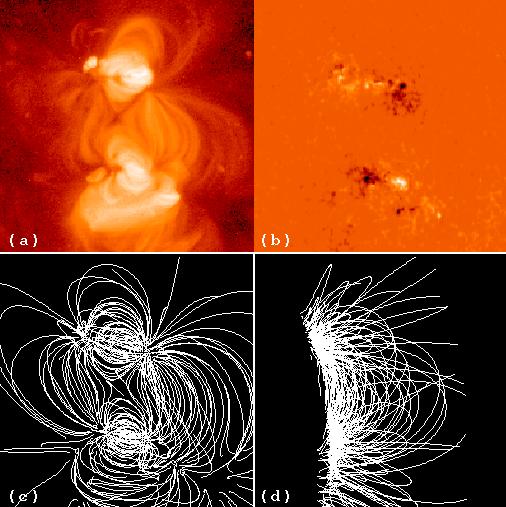
The four panels to the right show an example of these magnetic field calculations. Panel (a) contains an image of the Sun's corona obtained by the Soft X-ray Telescope on the Yohkoh spacecraft on January 4th, 1994. It shows an interconnecting system of hot coronal loops within and between two active regions on opposite sides of the Sun's equator. Panel (b) from Kitt Peak's magnetograph shows the line-of-sight magnetic field measurements with positive fields in white and negative fields in black (16x16 arcmin, 16:31 UT). Panel (c) shows the 3D magnetic field lines from a mathematical extrapolation of the surface fields. The magnetic field permeates the entire region but only selected field lines are displayed. These lines are in good agreement with the observed, Panel (a), structures but with some noticeable exceptions. Panel (d) shows a view of these field lines from the side. |
| ||
|
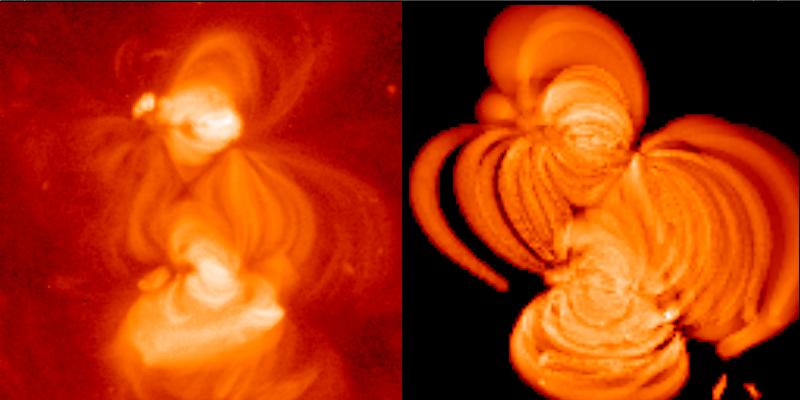
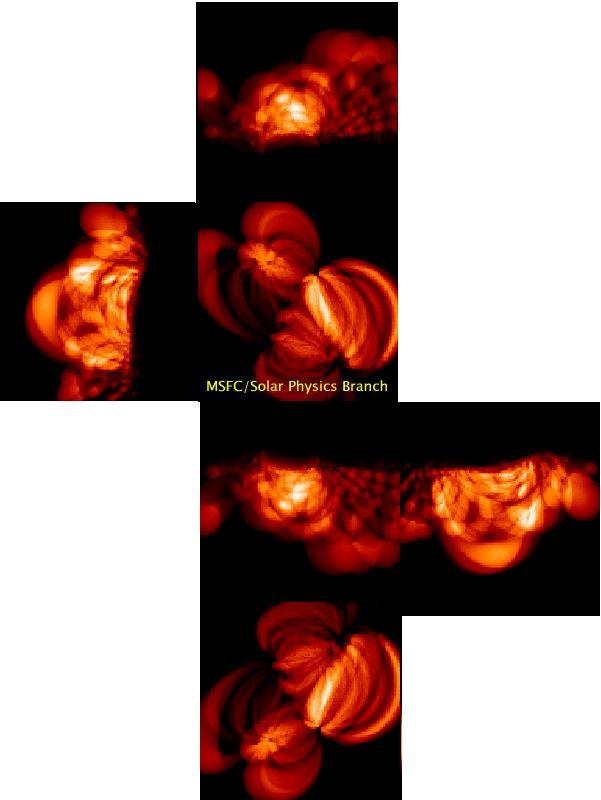
An outstanding problem is our lack of understanding about how the Sun chooses different field lines to populate with hot coronal plasma. MSFC Solar Astronomer Dr. Allen Gary has devised a program that wraps each selected field line with a tube of plasma and then compares an image containing that tube with the X-ray observations to determine the density of the plasma. The set of tubes that best match these observations are shown at the top of the page. The observations and an image of the variable density tubes are shown to the left. | ||
|
The three-dimensionality of these loops is better illustrated by a movie in which the loop system is rotated in a manner similar to how the Sun would rotate it through a series of observations over a two week period. This movie is available as a 1.3 MB MPEG movie, a 9.8 MB AVI movie, and a 15.6 MB Quicktime movie. A three-dimensional cube showing views of the loops from six different directions can be constructed from this image, and is illustrated in a 770 kb Quicktime movie. Electric currents flowing along these loops can alter their shapes and positions. To some extent the currents can be inferred from vector magnetic field measurements at their footpoints. An alternate method is to see how the loops are distorted from their current free configuration and then determine the currents required. A method of creating coronal loops using mathematical functions called splines has been developed by Dr. Allen Gary. An interactive illustration of this method is available at this link. | |||
