|
|
|
+ Home | ||
|
||||
| + Solar Cycle Prediction | + Magnetograph | + The Sun in Time | + The Hinode Mission | + The STEREO Mission |
Surface Flows
|
The surface of the sun is in constant motion due to the presence of several velocity components. These components include: rotation, cellular convection, oscillations, and meridional flow. The largest velocity signal is that due to solar rotation with an equatorial velocity of 2000 m/s. Both the oscillations and the convective motions have amplitudes of about 300 m/s. The meridional flow is the weakest at only about 20 m/s. Each of these components plays an important role in helping us understand the sun and how it produces its 11-year cycle of solar activity. Solar velocity data is available from the Global Oscillation Network Group (GONG) instruments and the Michelson Doppler Imager (MDI) on the SOHO Mission. Both of these investigations determine the flow velocities by measuring the Doppler shift of a spectral line formed by nickel atoms in the cooler layers of the solar atmosphere. | ||
|
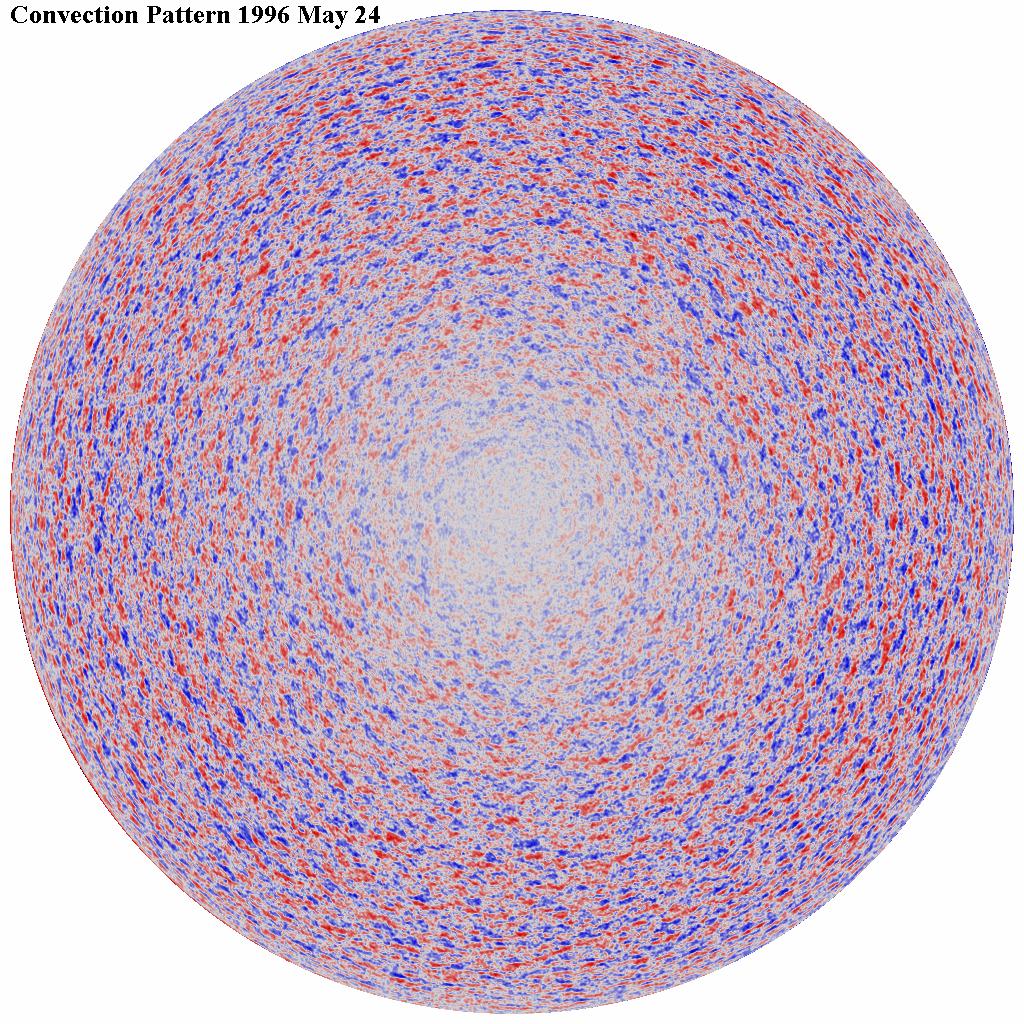
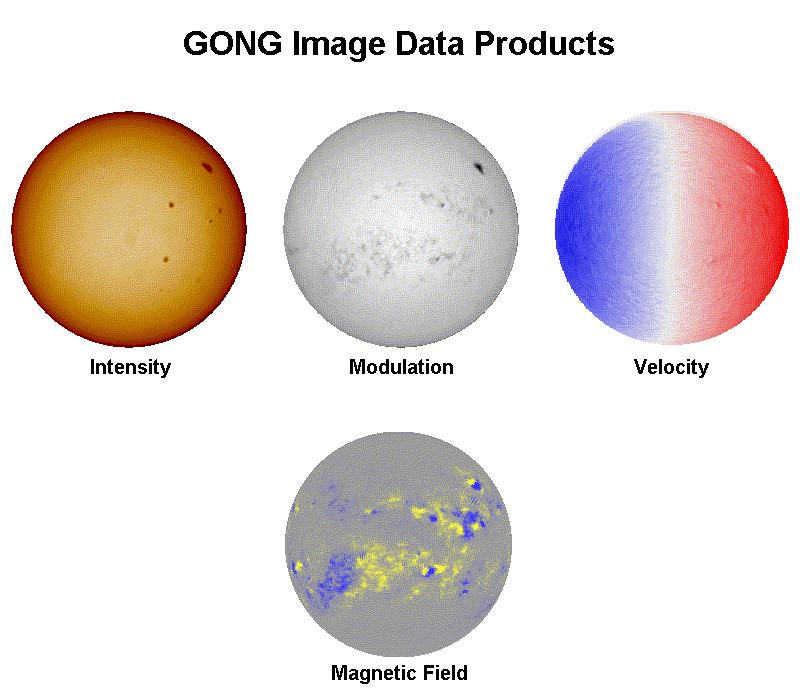
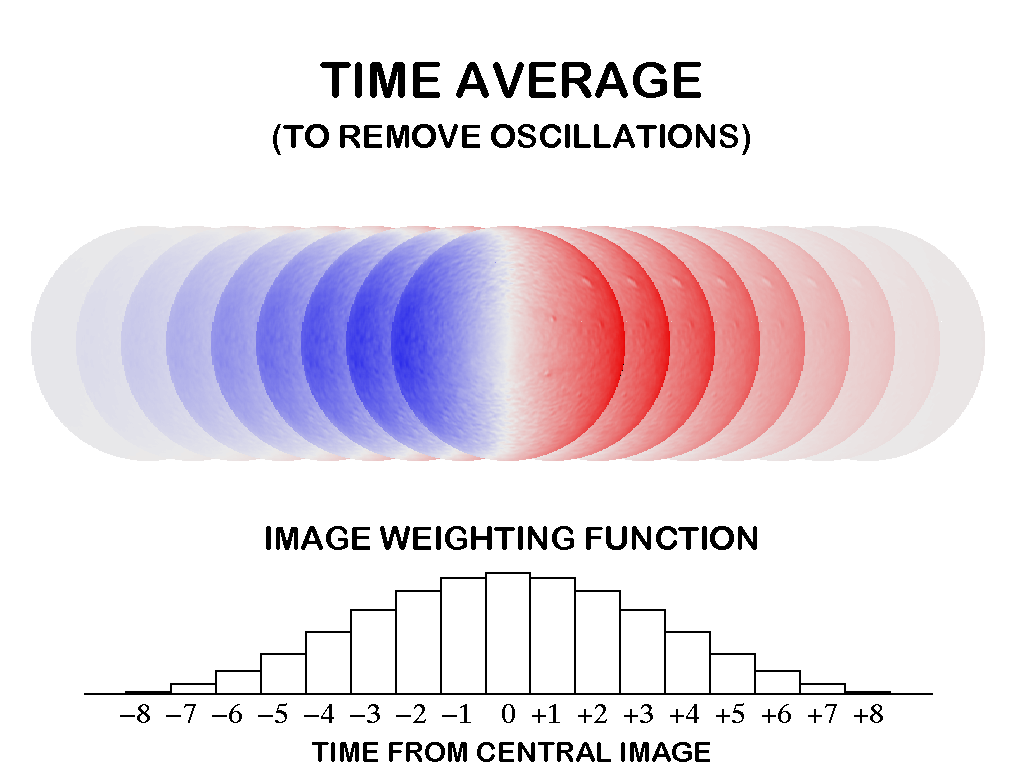
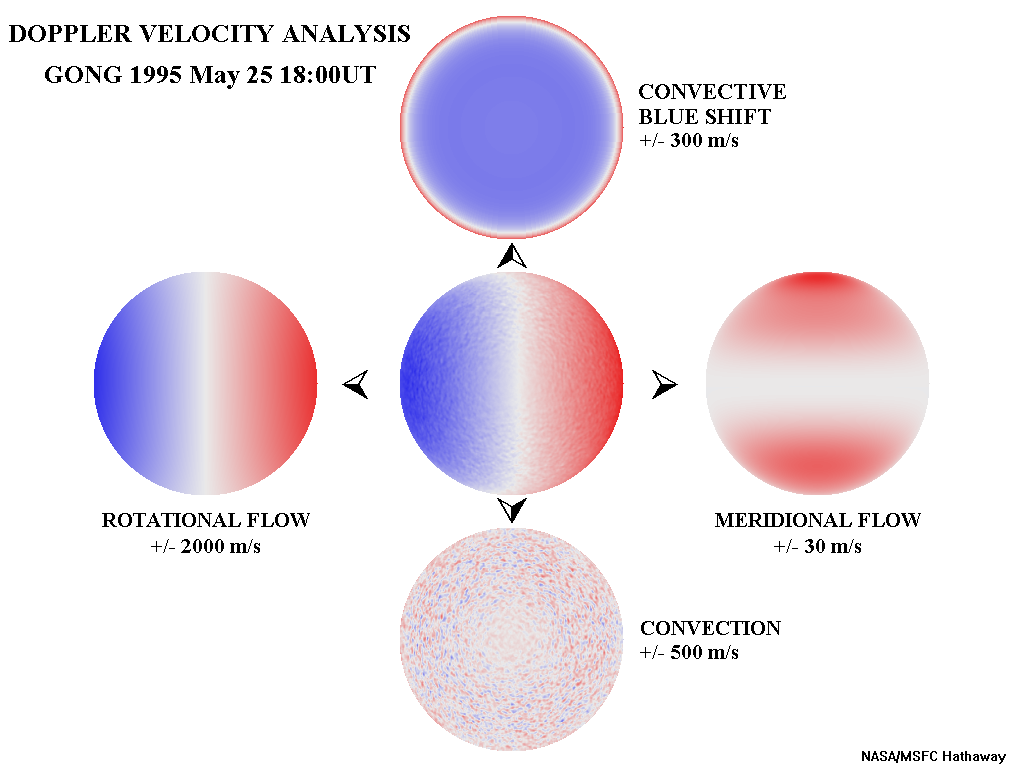
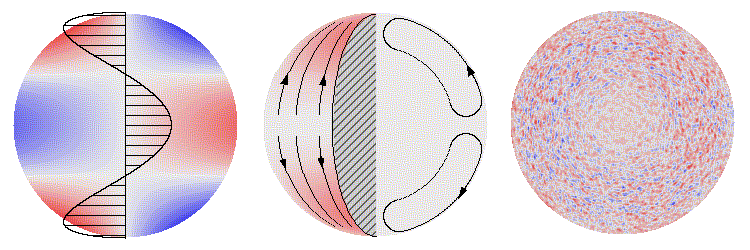
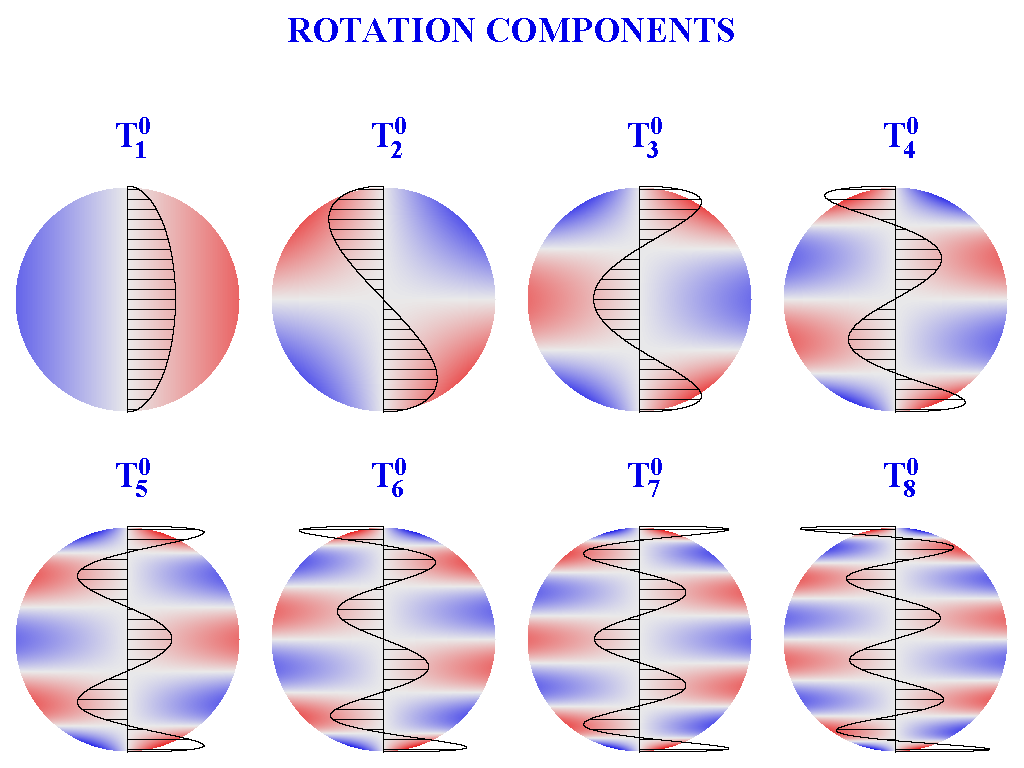
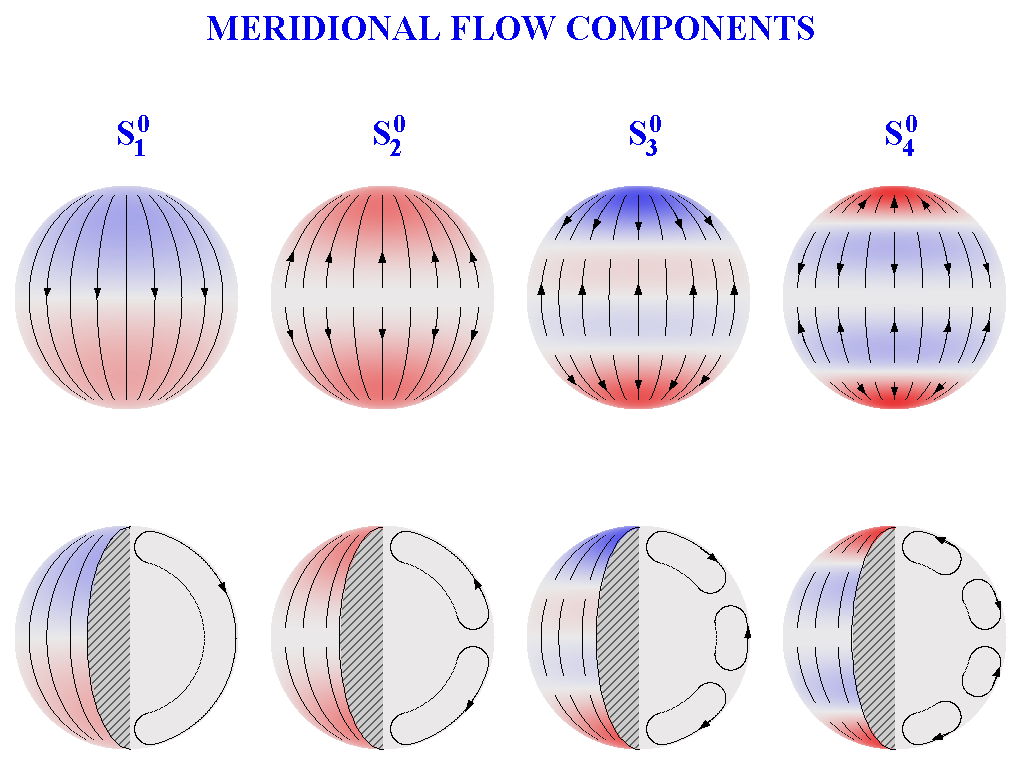
The GONG data presently consists of 1024 by 1024 pixel intensity images at three different spectral positions within the line with two different polarizations. These three images are processed to produce three primary data images . The sum of these raw images gives an intensity image which shows sunspots and limb darkening. The size of the change in intensity at the three spectral positions gives a modulation image that shows roughly where magnetic fields are located. The shift in the position of the spectral line with respect to its laboratory position gives a velocity image which is dominated by solar rotation and the cellular pattern of solar convection called supergranulation. GONG also produces magnetograms, images of the sun's magnetic field using the two different polarizations. The primary purpose of these GONG velocity images is to provide data for analyzing the oscillations of the sun. For studies of the nearly steady flows the oscillatory signal represents a source of noise and needs to be removed from the data. This is done by taking a weighted average of 17 velocity images taken at 1-minute intervals to produce an image of the nearly steady flows. These time averaged images are then processed by an image analysis program (121 kb GIF image) that separates the signal into its various components: (64 kb GIF image) Differential Rotation (142 kb GIF image) - the rotation signal that includes a rapidly rotating equator and slowly rotating polar regions; Meridional Flow (82 kb GIF image) - a flow directed from the equator towards the poles; Convective Blue Shift (267 kb GIF image) - a velocity artifact due to the correlation of bright convective elements with rising motions; and the Supergranulation (26 kb GIF image) convection pattern. | |||
|
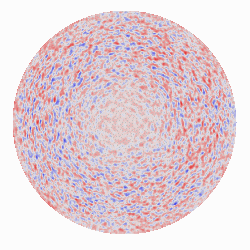
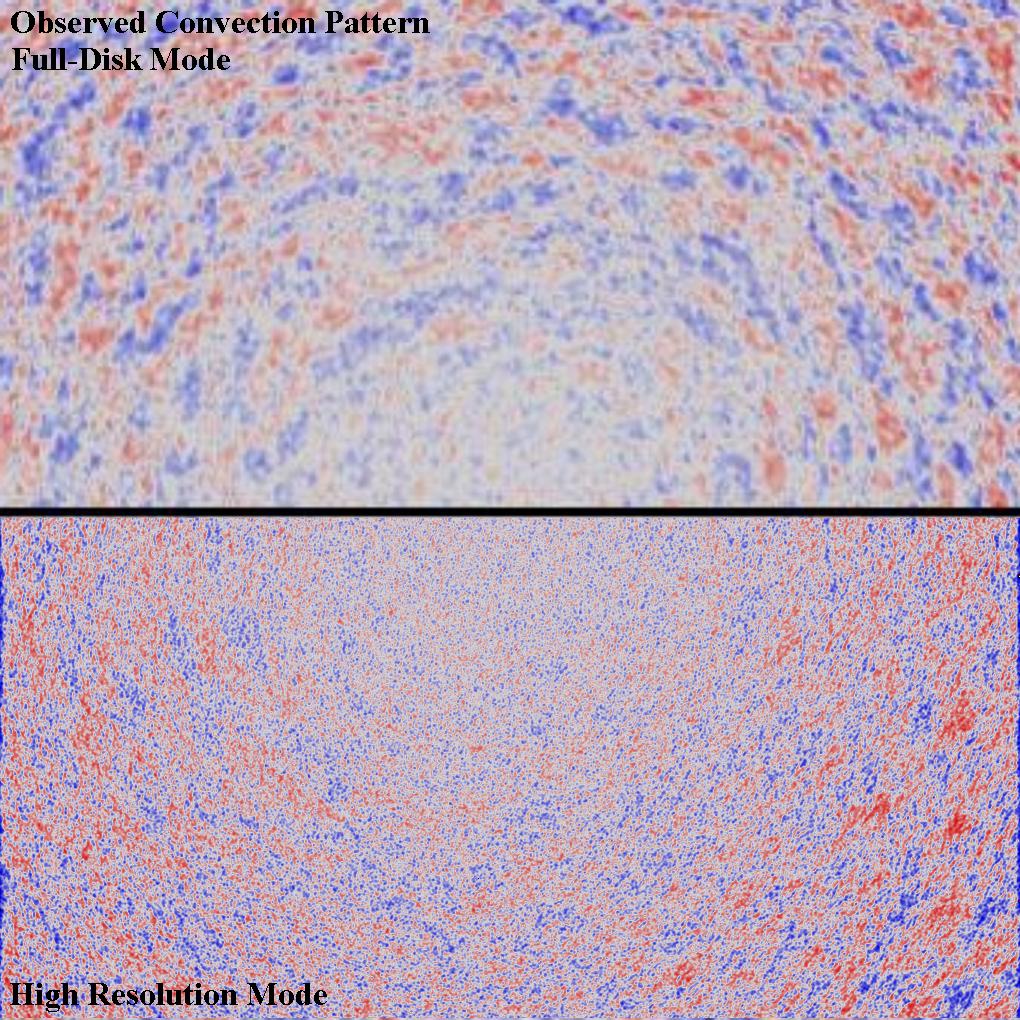
The SOHO/MDI data consists of 1024 by 1024 pixel intensity images at four different spectral positions within the spectral line. This higher resolution data provides excellent information on the cellular flows. Using the same image analysis program to separate the flow components provides a much clearer image of the supergranulation convection pattern. This instrument also has a high-resolution mode with 3X magnification. This higher magnification reveals even finer details of the sun's convective flow elements. | ||
