|
|
|
+ Home | ||
|
||||
| + Solar Cycle Prediction | + Magnetograph | + The Sun in Time | + The Hinode Mission | + The STEREO Mission |
The Sunspot Cycle
(Updated 2017/03/15)
Please note: Dr. David Hathaway, a member of the MSFC solar physics group for 29 years, transferred to NASA's Ames Research Center in California, and retired in December 2016. Dr. Hathaway is creating his own website, which will host sunspot cycle data and predictions. This link will take you away from this NASA site to Dr. Hathaway's new pages.
|
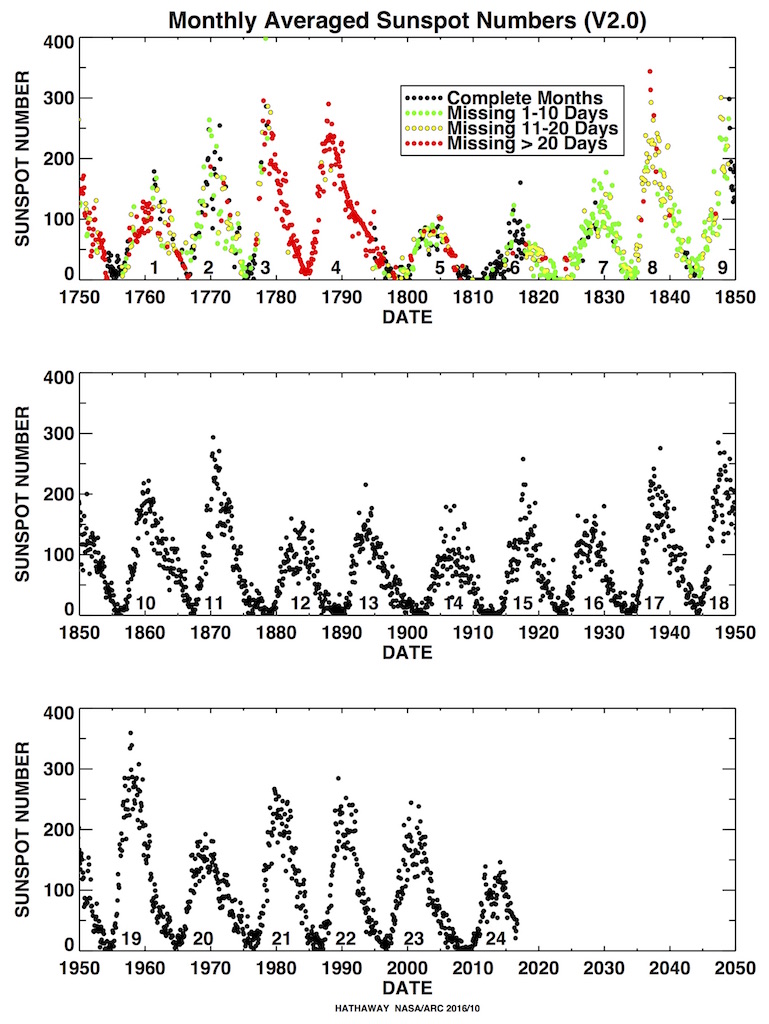
Sunspot NumbersIn 1610, shortly after viewing the sun with his new telescope, Galileo Galilei (or was it Thomas Harriot?) made the first European observations of Sunspots. Continuous daily observations were started at the Zurich Observatory in 1849 and earlier observations have been used to extend the records back to 1610. The sunspot number is calculated by first counting the number of sunspot groups and then the number of individual sunspots. | ||
|
The "sunspot number" is then given by the sum of the number
of individual sunspots and ten times the number of groups. Since most sunspot groups have,
on average, about ten spots, this formula for counting sunspots gives reliable numbers
even when the observing conditions are less than ideal and small spots are hard to see.
Monthly averages (updated monthly) of the sunspot numbers (181 kb JPEG image), (307 kb pdf-file), (62 kb text file) show that the number of sunspots
visible on the sun waxes and wanes with an approximate 11-year cycle.
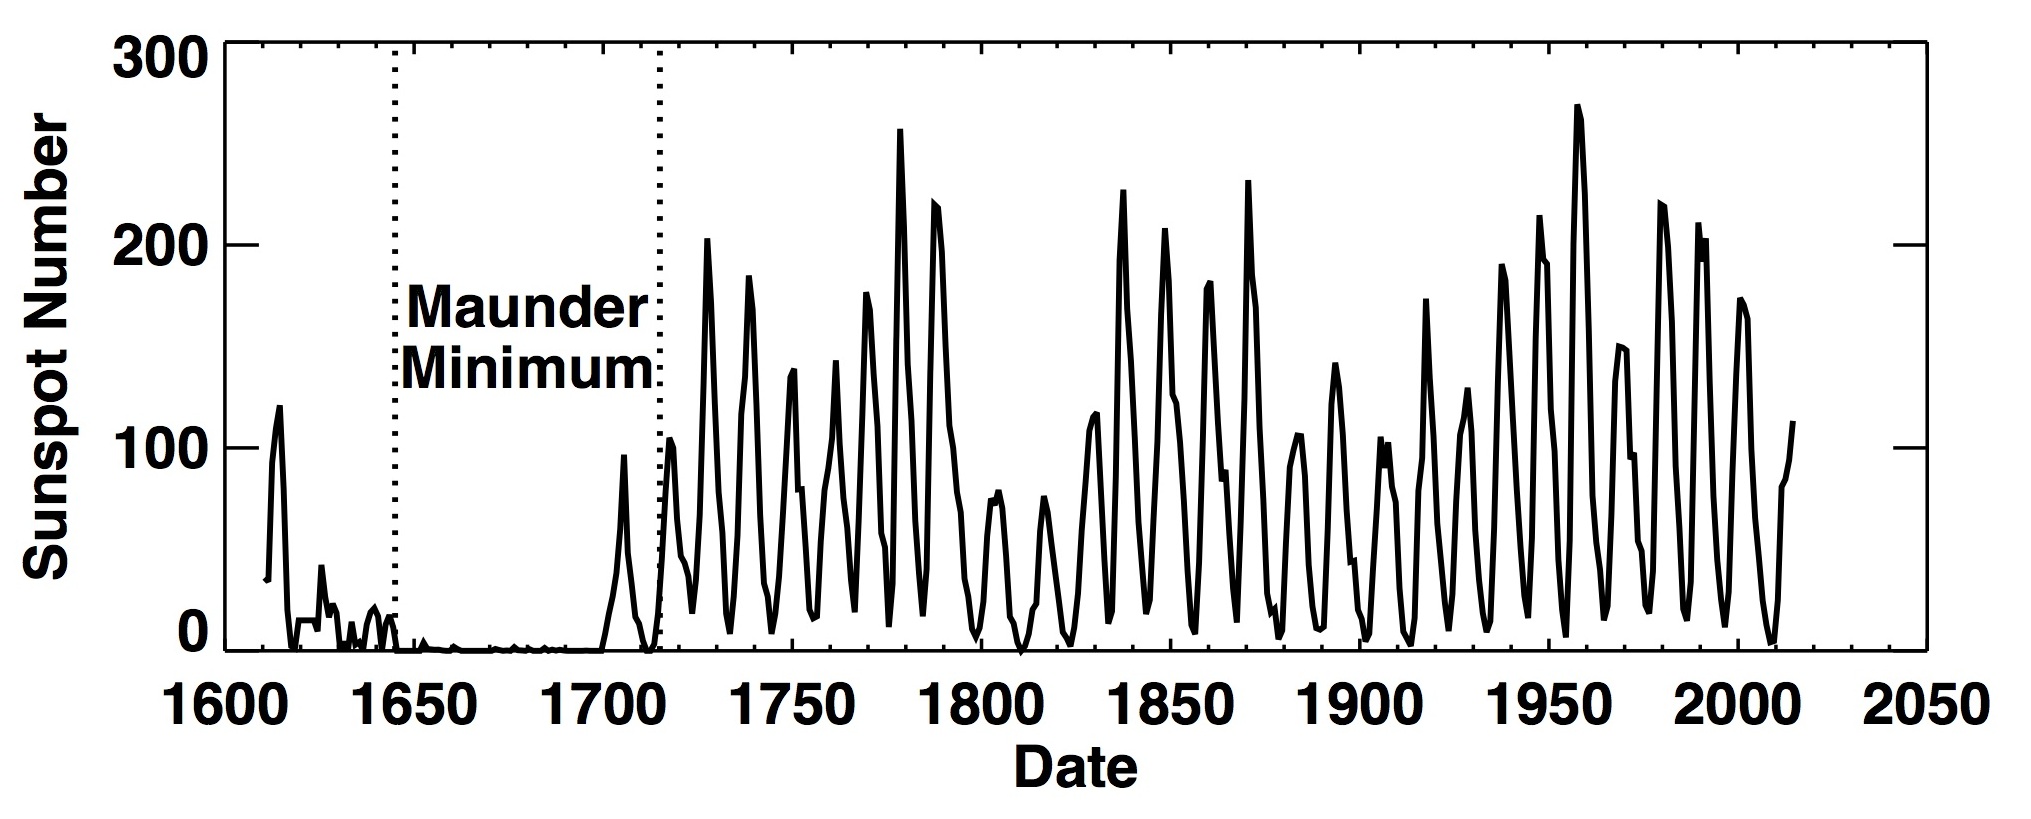
(Note: there are actually at least two "official" sunspot numbers reported. The International Sunspot Number as compiled by the Solar Influences Data Analysis Center in Belgium, has been revised recently (V2.0 -- summer 2015), and should now more closely match the NOAA sunspot number. The NOAA sunspot number is compiled by the US National Oceanic and Atmospheric Administration. The numbers tabulated in SN_m_tot_V2.0.txt are the monthly averages of the daily sunspot number with error estimates as posted at the WDC-SILSO, Royal Observatory of Belgium, Brussels.) The Maunder MinimumEarly records of sunspots indicate that the Sun went through a period of inactivity in the late 17th century. Very few sunspots were seen on the Sun from about 1645 to 1715 (38 kb JPEG image). Although the observations were not as extensive as in later years, the Sun was in fact well observed during this time and this lack of sunspots is well documented. This period of solar inactivity also corresponds to a climatic period called the "Little Ice Age" when rivers that are normally ice-free froze and snow fields remained year-round at lower altitudes. There is evidence that the Sun has had similar periods of inactivity in the more distant past. The connection between solar activity and terrestrial climate is an area of on-going research. | |||
The Butterfly Diagram | |||
|
Detailed observations of sunspots have been obtained by the Royal Greenwich Observatory since 1874. These observations include information on the sizes and positions of sunspots as well as their numbers. These data show that sunspots do not appear at random over the surface of the sun but are concentrated in two latitude bands on either side of the equator. A butterfly diagram (142 kb GIF image) (184 kb pdf-file) (updated monthly) showing the positions of the spots for each rotation of the sun since May 1874 shows that these bands first form at mid-latitudes, widen, and then move toward the equator as each cycle progresses. | ||
The Greenwich Sunspot DataThe Royal Greenwich Observatory data has been appended with data obtained by the US Air Force Solar Optical Observing Network since 1977. This newer data has been reformatted to conform to the older Greenwich data and both are available in a local directory of ASCII files. Each file contains records for a given year with individual records providing information on the daily observations of active regions. | |||
Sunspot Cycle Predictions | |||
|
MSFC Solar Physics Branch members Wilson, Hathaway, and Reichmann have studied the sunspot record for characteristic behavior that might help in predicting future sunspot activity. Our current predictions of solar activity for the next few years can be found at this link. Although sunspots themselves produce only minor effects on solar emissions, the magnetic activity that accompanies the sunspots can produce dramatic changes in the ultraviolet and soft x-ray emission levels. These changes over the solar cycle have important consequences for the Earth's upper atmosphere. | ||

