|
|
|
+ Home | ||
|
||||
| + Solar Cycle Prediction | + Magnetograph | + The Sun in Time | + The Hinode Mission | + The STEREO Mission |
The Solar Dynamo
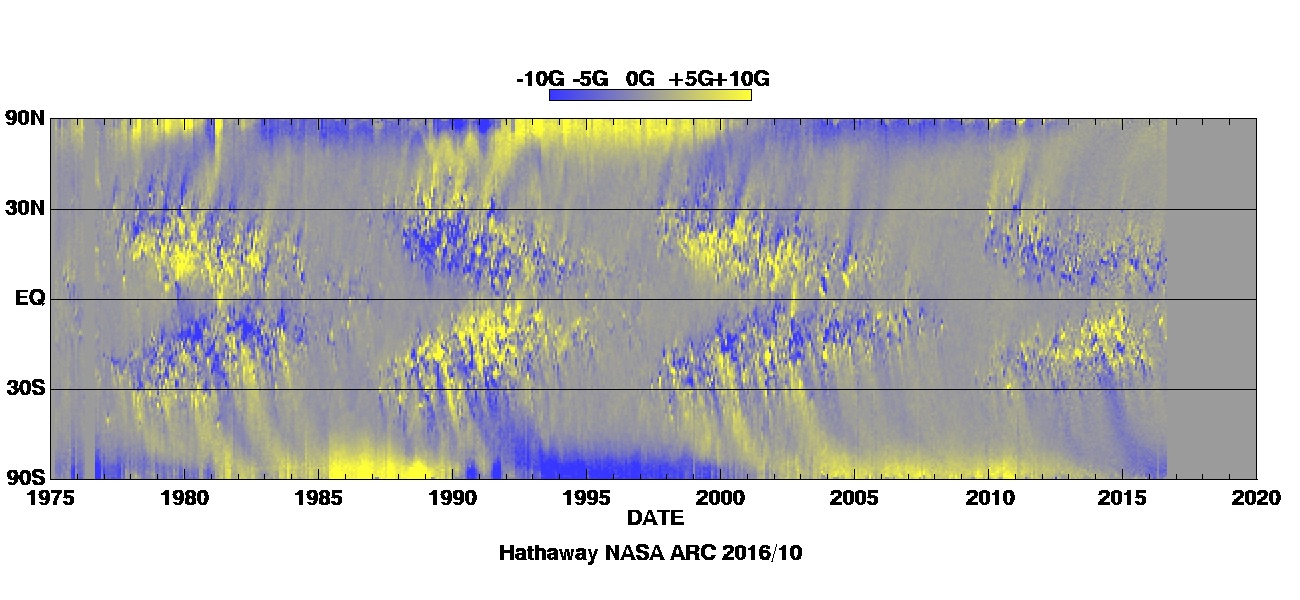
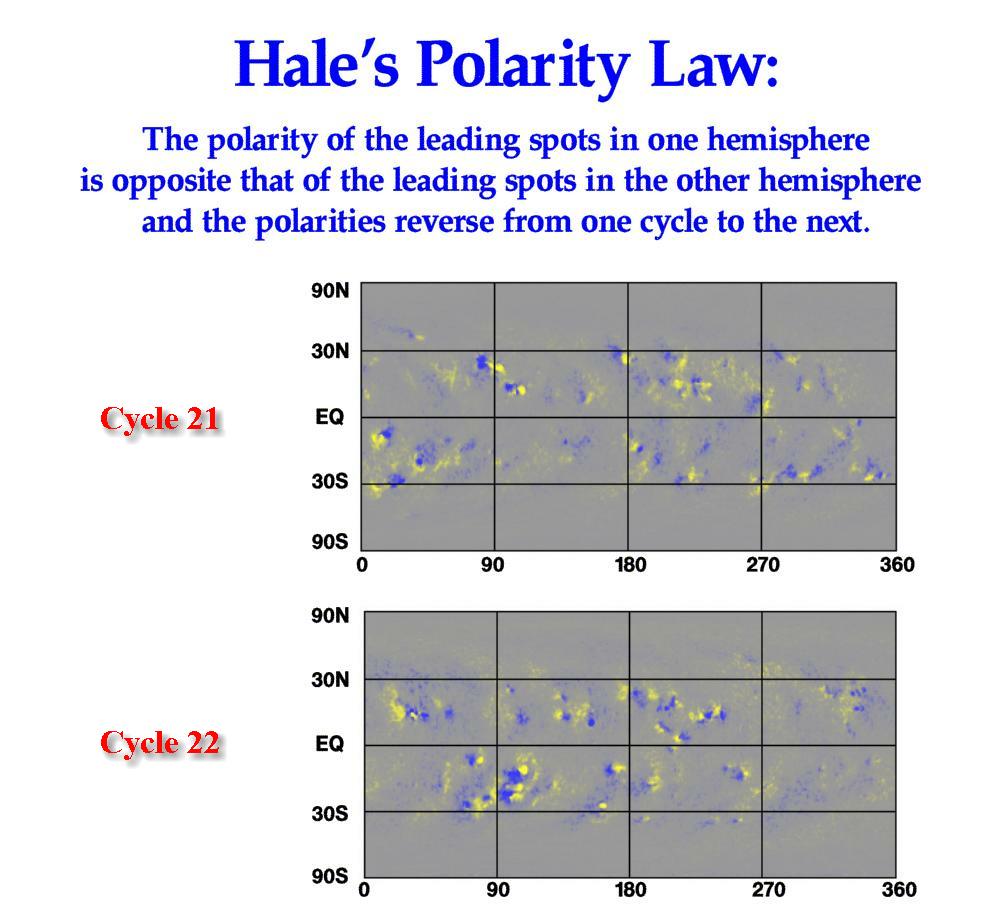
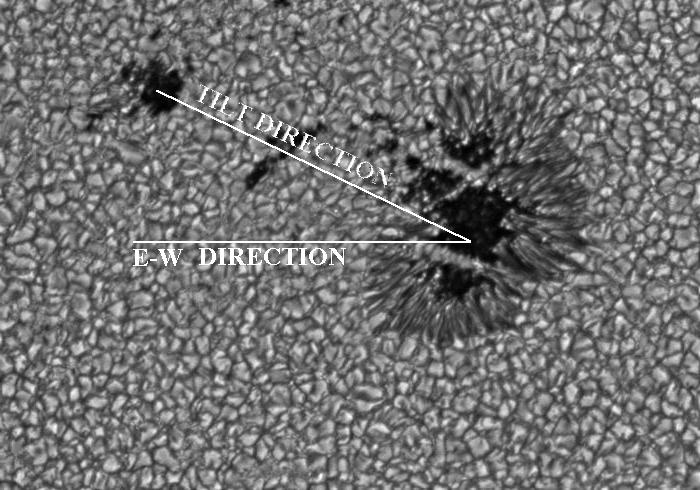
| It is widely believed that the Sun's magnetic field is generated by a magnetic dynamo within the Sun. The fact that the Sun's magnetic field changes dramatically over the course of just a few years, and the fact that it changes in a cyclical manner indicates that the magnetic field continues to be generated within the Sun. A successful model for the solar dynamo must explain several observations: 1) the 11-year period of the sunspot cycle, 2) the equator-ward drift of the active latitude as seen in the butterfly diagram, 3) Hale's polarity law and the 22-year magnetic cycle, 4) Joy's law for the observed tilt of sunspot groups and, 5) the reversal of the polar magnetic fields near the time of cycle maximum as seen in the magnetic butterfly diagram. | ||
|
These features of the Sun's magnetic dynamo can all be seen in a movie of the Sun's magnetic field over the last 30-years (86 Mb AVI Movie). Magnetic fields are produced by electric currents. These currents are generated within the Sun by the flow of the Sun's hot, ionized gases. We observe a variety of flows on the Sun's surface and within its interior. Nearly all of these flows may contribute in one way or another to the production of the Sun's magnetic field.
Magnetic fields are a little like rubber bands. They consist of continuous loops of
lines of force that have both tension and pressure. Like rubber bands, magnetic fields can
be strengthened by stretching them, twisting them, and folding them back on themselves.
This stretching, twisting, and folding is done by the fluid flows within the Sun.
| |||
|
The Omega EffectMagnetic fields within the Sun are stretched out and wound around the Sun by differential rotation - the change in rotation rate as a function of latitude and radius within the Sun. This is called the omega-effect after the Greek letter used to represent rotation. The Sun's differential rotation with latitude can take a north-south oriented magnetic field line and wrap it once around the Sun in about 8 months. | ||
|
The Alpha EffectTwisting of the magnetic field lines is caused by the effects of the Sun's rotation. This is called the alpha-effect after the Greek letter that looks like a twisted loop. Early models of the Sun's dynamo assumed that the twisting is produced by the effects of the Sun's rotation on very large convective flows that carry heat to the Sun's surface. One problem with this assumption is that the expected twisting is far too much and it produces magnetic cycles that are only a couple years in length. | ||
| More recent dynamo models assume that the twisting is due to the effect of the Sun's rotation on the rising "tubes" of magnetic field from deep within the Sun. The twist produced by the alpha effect makes sunspot groups that obey Joy's law and also makes the magnetic field reverse from one sunspot cycle to the next (Hale's law). | |||
|
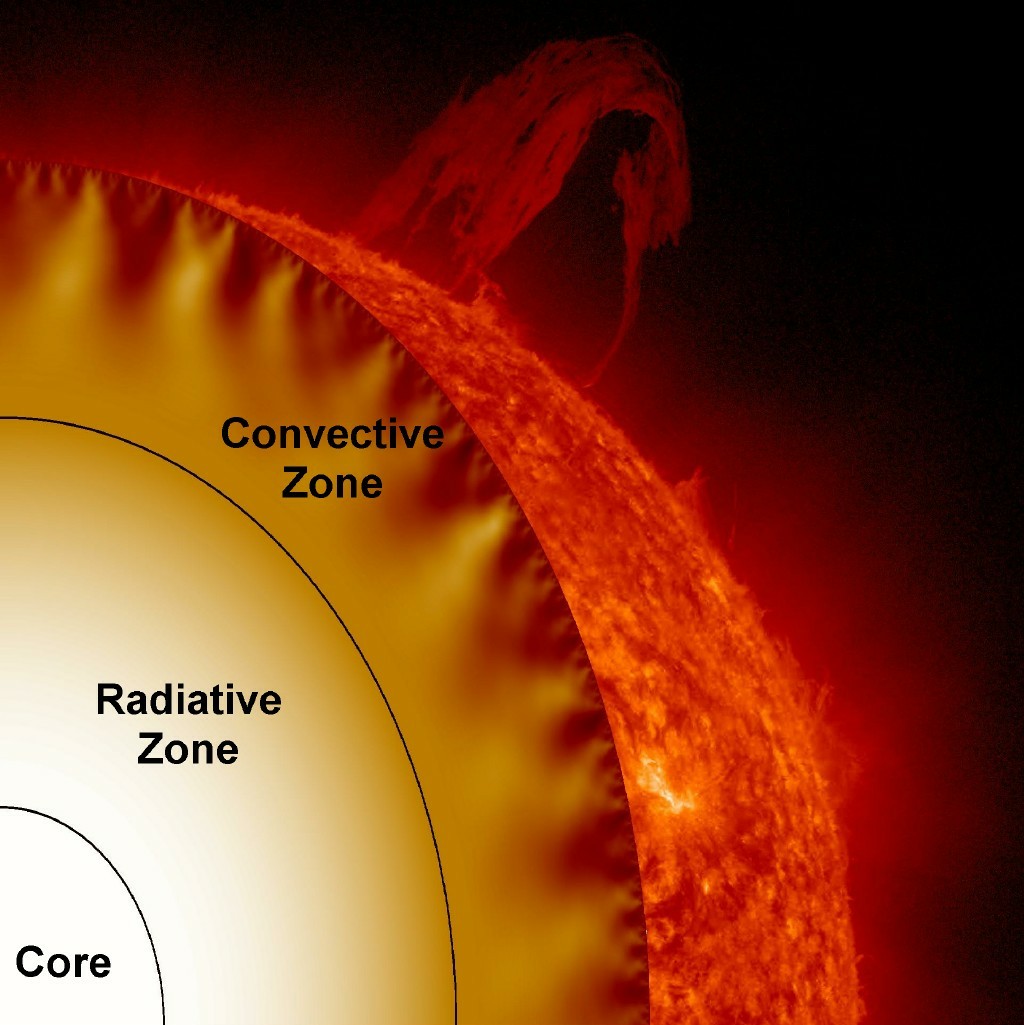
The Interface DynamoEarly models of the Sun's magnetic dynamo worked on the idea that the dynamo activity occurs throughout the entire convection zone. It was soon realized, however, that magnetic fields within the convection zone would rapidly rise to the surface and wouldn't have enough time to experience either the alpha or the omega effect. Since a magnetic field exerts a pressure on its surroundings, regions with a magnetic field should push aside the surrounding gas and make a bubble that would continue to rise all the way to the surface. | ||
| This buoyancy is not produced in the stable layer below the convection zone. Within the radiative zone the magnetic bubble would rise only a short distance before it would find itself just as dense as its surroundings. This led to the idea that the Sun's magnetic field is being produced in the interface layer between the radiative zone and the convection zone. This interface layer is also a place where we find rapid changes in rotation rate as we look inward or outward across it. | |||
|
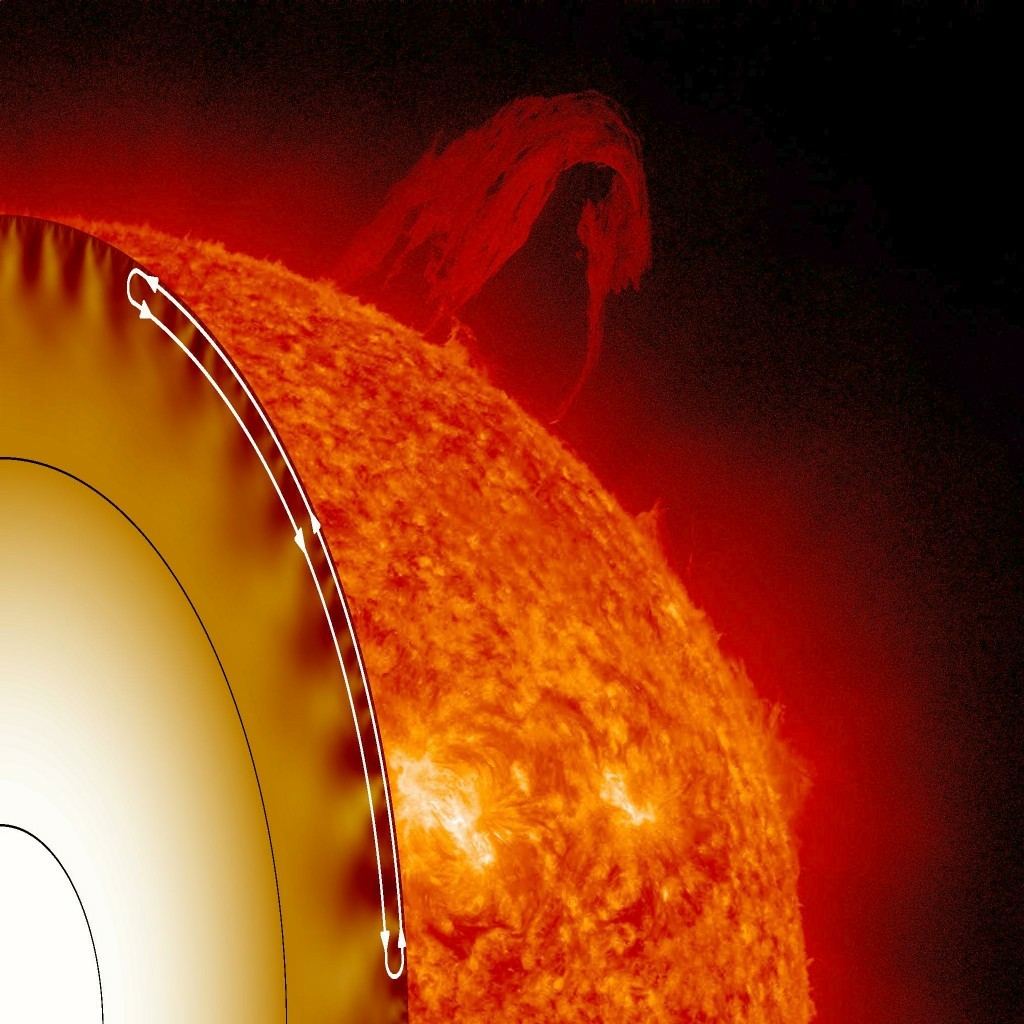
The Meridional FlowThe Sun's meridional flow - the flow of material along meridian lines from the equator toward the poles at the surface and from the poles to the equator below the surface- must also play an important role in the Sun's magnetic dynamo. At the surface this flow is a slow 20 m/s (40 mph) but the return flow toward the equator inside the Sun where the density is much higher must be much slower still - 1 to 2 m/s (2 to 4 mph). This slow return flow would carry material from the mid-latitudes to the equator in about 11 years. | ||
| This rate of flow is very similar to that of the sunspot activity bands seen in the sunspot butterfly diagram. The magnetic butterfly diagram also shows the weak surface fields being carried toward the poles by the meridional flow at the surface. The strength and structure of the meridional flow varies substantially over the course of each sunspot cycle and from one sunspot cycle to the next (see Hathaway and Rightmire 2011 ). This suggests that the variations in the meridional circulation are the source of variations in sunspot cycle amplitudes - neither the differential rotation (the Omega Effect) nor the convective motions (one source of the Alpha effect and the source of diffusion) vary as much. | |||

