 |
|
+ Home | ||

|
||||
| + Solar Cycle Prediction | + Magnetograph | + The Sun in Time | + The Hinode Mission | + The STEREO Mission |
Vector Magnetographs
A magnetograph is used to measure magnetic fields. Solar astronomers are interested in measuring the Sun's magnetic field because of the key role it plays in solar atmospheric structure and solar activity. The most straightforward measurement of the magnetic field is that of the "longitudinal" component of the magnetic field, or the component which is directed toward or away from us. In addition to the longitudinal component, a vector magnetograph also measures the component of the magnetic field directed across our line-of-sight, the "transverse" component of the magnetic field.
To solve scientific problems, researchers employ a technique known as the scientific method, which includes four main parts: observation, hypothesis, test, and theory. Studies of the Sun approach the observation portion of the scientific method from many different angles. The Sun may be observed, as Galileo (1564-1642) did in 1609, with a simple telescope. While Galileo learned much about the Sun and sunspots from his observations, his simple telescope could "see" only one portion of the solar atmosphere, a layer called the photosphere. Not until the advent of spectroscopy could solar scientists study different levels of the solar atmosphere, as well as different features of the photosphere.
A long time passed however, between Galileo's simple telescopic observations and spectroscopic ones. In the early 1800's, Joseph von Fraunhofer (1781-1826) studied the spectrum of the Sun using high magnification. To his surprise, he discovered dark lines superimposed on the spectrum. In the mid 1800's laboratory experiments revealed that each chemical produces its own characteristic spectrum with a specific pattern of spectral lines, a "fingerprint" of the element. Some of these "fingerprints" were identified in Fraunhofer's spectrum of the Sun; iron, for instance, was detected, meaning that vaporized iron exists in the atmosphere of the Sun.
The next refinement of solar observational techniques was effected by a French astronomer, Pierre Jules Janssen (1824-1907), in the 1860's. By using a spectroscope, Janssen was able to observe solar prominences at times other than during a solar eclipse. Janssen also perfected high resolution solar photography and in 1896, published a collection of over 20 years of observations. Following in the mental footsteps of Janssen, Charles Young of Princeton at Halstead Observatory, applied the new science of spectroscopy specifically to the study of sunspots. Young observed many double lines in the spectra of the spots but incorrectly hypothesized their cause to be a line reversal from layers of gas at different temperatures, lying one on top of the other.
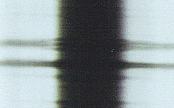
 Then, in August of 1886, Dutch physicist Pieter Zeeman observed the spectrum
from a sodium flame which had been placed between magnets. Remarkably, the emission lines
were broadened or split into two or three lines as shown in the figure here.
 From more laboratory tests, Zeeman determined that the amount of splitting
is dependent on the magnitude of the magnetic field through which the light passes. In
mathematical terms, distance between the components of the spectral line,
Dl= (eBl2)/4pmc
for B in Gauss. Zeeman's discovery set the stage for the next quantum leap in the study of the sun.
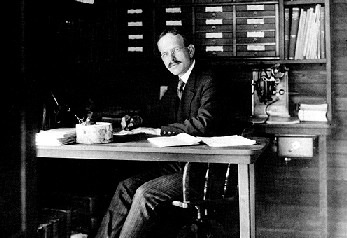
 George Ellery Hale (1868-1938), was the founder of the Mt. Wilson
Observatory in California. A native of Chicago, Hale attended and received a degree
in engineering from the Massachussetts Institute of Technology (MIT). After
graduation, Hale pursued his life-long interest in astronomy and began observing the Sun
from a small, private observatory at Kenwood in Chicago, an operation financed by his
father. With the assistance of F. Ellerman, Hale perfected the spectroheliograph and
began the study of spectra associated with sunspots.
After obtaining over 3000 photographs of solar phenomena, Hale realized that his spectra
needed better dispersion (spreading out). To do this, a benefactor, Miss Helen Snow,
financed the construction of a horizontal telescope which fed a long-focus spectrograph.
Because the mirrors of the telescope were glass and because of heated air in the
optical path, Hale was unable to obtain the high resolution images he desired; he set
about finding a new home for the Snow telescope where temperatures could be lowered.
In 1904 to 1905, the Snow telescope, a 5-foot focal length spectroheliograph, and an
18-foot focal length solar spectroscope were installed on Mount Wilson in California.
As soon as these instruments were put into use, Hale made two very important
discoveries: (1) the temperature of sunspots is cooler than the surrounding photosphere
and (2) there is a magnetic field associated with sunspots.
To verify the existence of magnetic fields in sunspots, Hale made observations using the
large spectrograph of the 60 foot solar tower which had been built in 1907.
Additional features were added: a fresnel rhomb (a quarter-wave plate) and a Nicol prism
(polarization analyzer). When the light from the sunspots passed through the quarter
wave plate, Hale photographed the spectrum and noted the relative intensities of the
spectral lines. When the quarter-wave plate was rotated by 90 degrees, the relative
intensities of the doublet lines were reversed, proof that the light being emitted from
the sunspots passed through a magnetic field.
All magnetographs utilize the same basic principles as Hale's. They take advantage
of the fact that light not only has brightness or intensity but can also
"vibrate" in certain, specific directions. That is, the light may be
polarized; its direction of vibration is not symmetrical about the direction it is moving.
Light which is polarized looks to the eye to be no different than unpolarized
light, but when it reflects off a glass surface and is reflected to another glass surface,
the intensity of the polarized light will be reduced when the second glass surface is
rotated.
Light may be polarized in many ways, e.g., reflection off a glass surface or passing
through a magnetic field. Perhaps the type of polarization with which we are most
familiar is that of sunlight reflecting from the hood of a car. By using Polaroid
sunglasses, the intensity of the light reflected to our eyes may be greatly reduced.
Polaroid sunglasses are based on the following: only light vibrating in the
vertical direction can pass through the optics, when the optics are rotated by 90 degrees,
the light is completely blocked.
There are two basic types of magnetographs: the longitudinal or line-of-sight magnetograph
and the vector magnetograph. The names refer to the fact that a magnetic field is a
vector quantity which can be broken down into components.
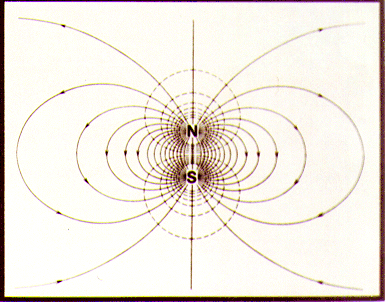
 Vectors have both
size (or magnitude) and direction, direction is indicated by the arrowheads in this
schematic of a dipole magnetic field. A longitudinal magnetograph measures only the
size of the magnetic field directed along the line-of-sight. However, the vector
magnetograph measures the full vector and so returns three quantities: the size of the
line-of-sight component, the size of the transverse or horizontal component, and the
direction of the transverse component. With vector magnetic field measurements, it
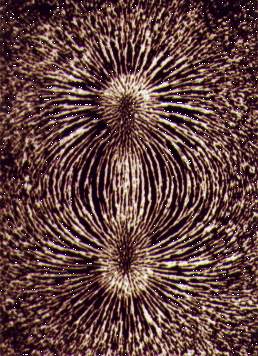
would be theoretically possible to reproduce a mapping of the field which would correspond
to the real thing; in other words, scientists could reproduce the dipole field mapping to
the left from an analysis of the light passing through the field of the two magnets,
below.

The MSFC vector magnetograph works by measuring the amount of polarization in the light
which originates from sunspots at one specific wavelength, 5250.2 A (1 A is equal to
10^(-10) or 0.0000000001 m). This particular wavelength was chosen because it is
magnetically sensitive (i.e., the line will split into components when in the presence of
a magnetic field), and because the light which produces the line originates from the
photospheric layer of the solar atmosphere, where we observe sunspots. Polarized
light is composed of two parts: circular and linear. The line-of-sight component of
the magnetic field produces the circular part, the transverse produces the linear.
Circularly polarized light can be vibrating either clockwise (right) or counterclockwise
(left) with respect to the magnetic field and linearly polarized light vibrates either
parallel or at right angles to the field. The job of the magnetograph then, is to
separate light into circular and linear polarized components and to record the value of
the intensity of the light in these different modes.
Circular polarization of a magnetically sensitive spectral line gives a measure of the longitudinal magnetic field, the strength of the field directed toward and away from the instrument. Linear polarization provides information on the strength and direction of the magnetic field transverse to, or across, the line of sight. Examples of these measurements for active region AR6555 are shown in this image (94 kb GIF).
Usually the magnetic field rises up from the solar interior in one spot, or set of spots, and then threads its way through the corona directly to another spot where the field lines are directed back into the sun. This is illustrated by a comparison (129 kb GIF) of the coronal loops seen in soft X-rays by Yohkoh with the magnetic field lines extrapolated upward from the surface magnetic field measurements.
Sometimes the magnetic field becomes sheared and twisted by fluid motions within the Sun. Sheared magnetic field (9 kb GIF) is indicated by transverse magnetic fields (the arrows in this image) that do not point from rising field areas (solid contours) to sinking field areas (dashed contours). The MSFC magnetograph group made an important contribution to solar science by quantifying the amount of shear within sunspots and correlating that with the occurrence of flares.
References:
Bray and Loughhead, Sunspots, 1964, Dover, New York.
Gary, Allen, Numerical Modeling Techniques for Extrapolating Solar Vector Magnetic Fields from the Photosphere, in Proceedings of the Conference Methoden und Verfahren der Mathematischen Physik, Oberwolfach, Germany, 1989.
Jenkins and White, Fundamentals of Optics, 1976, McGraw-Hill, New York.